Known for Centuries, Regulated in Decades
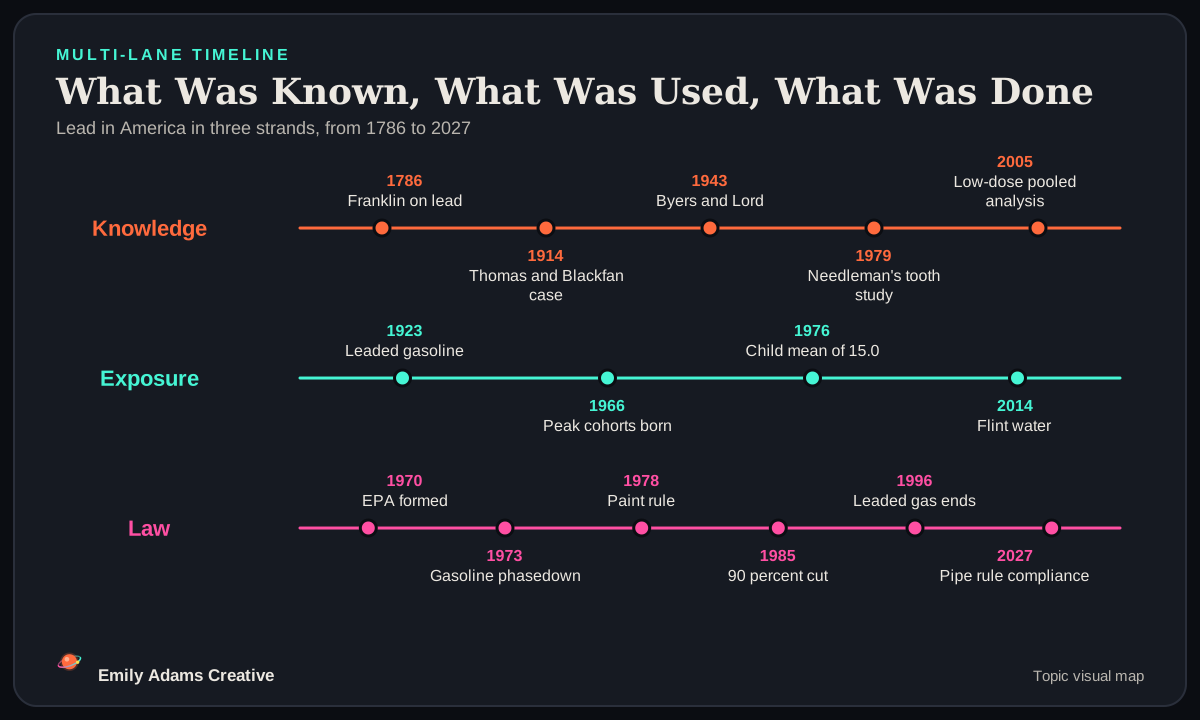
Lead was never a mystery poison. Miners, smelter hands and physicians knew its acute effects for centuries, and Benjamin Franklin wrote about its hazards in 1786. In the late 1800s, doctors in Australia traced childhood poisonings to paint and household dust. In 1914, Henry Thomas and Kenneth Blackfan reported an American child fatally poisoned by lead paint.

What took longer to establish was how much harm lead did when it did not kill. In 1943, Byers and Lord followed children who had survived lead poisoning and found lasting learning and behavior problems. A child who looked recovered had not recovered neurologically. From the 1970s on, studies such as Herbert Needleman’s tooth-lead research showed that low, symptomless exposure was tied to weaker thinking and classroom performance.
Those are three separate milestones. Acute toxicity was known for centuries. Lasting injury to children was documented by the 1940s. Evidence that low, silent doses affect development arrived from the 1970s on and grew stronger through 2005. It would be wrong to say every institution in 1923 knew the modern dose-response curve. It would be just as wrong to treat the decades between the warnings and decisive federal action as decades without warning.
Where the Lead Came From
The twentieth-century epidemic was made by people. Tetraethyl lead went into gasoline in the 1920s, and exhaust spread it through every American city, settling into street dust and yard soil. Lead went into house paint, plumbing, batteries and canned-food solder.
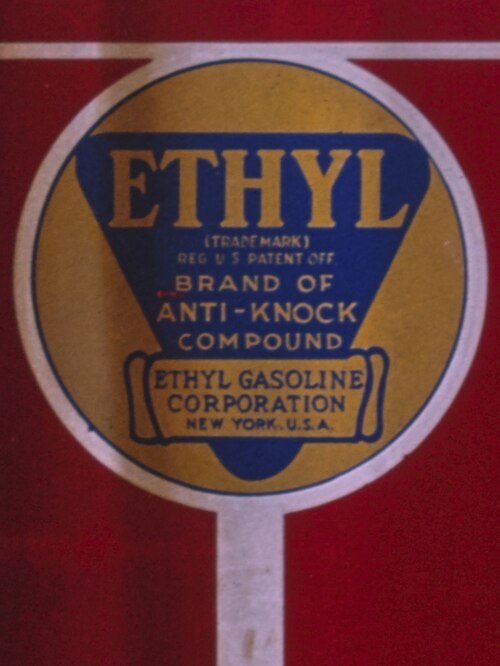
Each pathway reached people differently. Paint poisoned through chips and, more often, through the dust made when old coats peel or are dry-scraped and sanded. Gasoline reached nearly everyone, rich or poor, with heavier loads in traffic-dense neighborhoods. Smelters, mines and battery plants contaminated the communities around them. Drinking water picked up lead from pipes, solder and fixtures, especially when corrosion control failed. Workers carried lead dust home on clothing and tools.
The paint industry did not simply sell a product that later proved dangerous. Historians Gerald Markowitz and David Rosner documented how the Lead Industries Association promoted household lead paint, including marketing aimed at children, at a time when child poisonings were recognized, and how it resisted warnings and restrictions.
Bans stop new uses; they do not remove old ones. Paint already on walls, lead already in soil, and pipes already in the ground stayed where they were, which is why exposure continued long after the products left store shelves. A few sources are still in use, including leaded aviation gasoline.
The Laws, and What Each Left Undone
“Lead paint was banned in 1978, so it isn’t a problem anymore.”
The 1978 federal rule stopped the sale of lead paint for homes. It did not remove the paint already on walls. That is why EPA still requires certified lead-safe practices for renovation in pre-1978 housing and why federal rules require lead disclosure when many of those homes are sold or rented.
Federal action came in a cluster after 1970. The new Environmental Protection Agency and the Clean Air Act gave Washington tools to regulate fuel additives and air. The Lead-Based Paint Poisoning Prevention Act of 1971 addressed paint in federally assisted housing. In 1973, EPA ordered the first gasoline lead phasedown, with exceptions and delays for some small refiners.
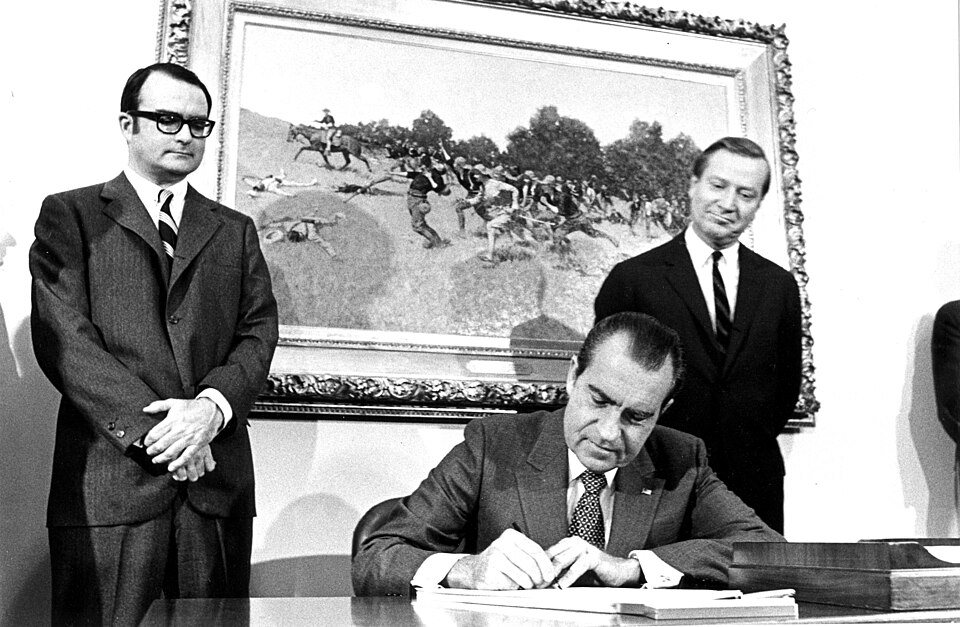
In 1978 came limits on consumer residential lead paint and a national air standard for lead. In 1985, EPA required a cut of about 90 percent in the lead allowed in leaded gasoline, effective in 1986. Congress addressed lead in new plumbing and in drinking fountains in 1986 and 1988, EPA issued the Lead and Copper Rule in 1991, and Title X in 1992 turned federal attention to dust, soil, disclosure and abatement. On-road leaded gasoline was prohibited in 1996.
Nearly every law had a limit built in. The 1978 rule stopped new residential lead paint but did not strip a single wall. The real-estate disclosure rule requires many sellers of pre-1978 homes to share what they know, not to abate. The Lead and Copper Rule’s action level is a compliance trigger, not a health threshold. The Renovation, Repair and Painting Rule, in force since 2010, requires certified practices for covered work, not removal.
The results are measured. Among children ages 1 to 5, the national geometric mean blood lead level fell from 15.0 micrograms per deciliter in 1976 to 1980 to 3.6 in 1988 to 1991 and 2.7 in 1991 to 1994, according to national health surveys. No single measure isolates the effect of each policy, but the fall came as regulation took hold.
What Lead Does, From Before Birth to Old Age
No blood lead level in children is known to be safe, the CDC says, and harm appears at concentrations once treated as acceptable. In 2003, a Rochester study found IQ losses below 10 micrograms per deciliter, the threshold of concern at the time, and a pooled analysis of seven cohorts in 2005 found the steepest losses at the lowest levels. In 2021 the CDC lowered its blood lead reference value from 5 to 3.5 micrograms per deciliter, a marker for finding children with relatively high levels, not a line below which lead is harmless.
The effects change with age. Exposure before birth can come from the mother’s surroundings and from lead stored in her own bones. In the first two years, lead disrupts sensitive windows of brain development, and very high doses cause encephalopathy. From ages 3 to 5, studies find lower average IQ and weaker language, attention, inhibition and working memory. School-age children show problems with reading, attention and organization. Findings in teenagers, such as more impulsivity, usually reflect earlier exposure, not exposure during adolescence.
In adults, research ties childhood exposure to persistent cognitive differences and to some differences in personality traits and psychiatric symptoms, while adult work exposure can cause new injury at any age. Lead also affects blood formation, the kidneys, and blood pressure and the heart. In older adults the question becomes whether early exposure leaves a lasting gap, speeds decline, or raises the risk of dementia.
Lead does not touch one thing called intelligence. Researchers measure separate functions: processing speed, working memory, executive function, inhibitory control, attention, language and motor skills. A shift of a few points in a population average can matter a great deal even when no individual appears impaired.
The Most Exposed Generations, 1940 to 2000
“Gen X lost five or six IQ points from lead.”
That overstates what was measured. A 2022 PNAS model estimated an average loss of about 5.9 IQ points for people born 1966 to 1970, compared with a hypothetical lead-free childhood. It is a modeled estimate for a whole cohort, not test scores compared across generations, and it cannot tell any one person what lead cost them.
Which Americans carried the most lead as children? The best national answer is a 2022 study in PNAS by McFarland, Hauer and Reuben. They combined the national blood lead surveys, which begin in 1976, with historical leaded gasoline use to reconstruct earlier years, and estimated the share of each birth cohort alive in 2015 whose early-childhood blood lead reached about 5 micrograms per deciliter or more.
The estimated share was 50.9 percent for people born 1940 to 1945. It rose to 89.6 percent for those born 1951 to 1955 and 97.1 percent for 1961 to 1965, and the model rounds to 100 percent for both 1966 to 1970 and 1971 to 1975. It stayed at 99.0 percent for 1976 to 1980, then fell quickly: 72.5 percent for 1981 to 1985, 37.0 for 1986 to 1990, and 13.1 for people born 1996 to 2000. The high-exposure years run from roughly 1951 to 1980.
The same model estimated the IQ cost. Against a hypothetical lead-free childhood, it put the average modeled loss at about 4.8 points for people born 1961 to 1965, 5.9 for 1966 to 1970, and 5.7 for 1971 to 1975, and the total at about 824 million IQ points among Americans alive in 2015, roughly 2.6 per person.
These are model estimates, not blood tests of every child and not test scores compared across generations. The 100 percent figures are rounded outputs. And timing matters: people born before 1960 often had more exposure as teenagers and adults, which childhood estimates miss, while children born after 1996 missed leaded gasoline but not old paint or pipes.
A Gap, a Faster Decline, or a Disease
For people now in their fifties, sixties and older, the question is what childhood lead means for aging. Three different ideas are often blurred together. The first is a permanent gap: early exposure lowers development, and the difference persists without widening. The second is faster decline: lead speeds the rate at which thinking deteriorates in adulthood. The third is disease: accumulated lead raises the risk of Alzheimer’s disease or dementia.

The evidence for a gap is the strongest. The Dunedin study in New Zealand found that children with higher blood lead at age 11 had lower IQ at 38. In the United States, a national study of older adults with likely childhood exposure through drinking water found lower cognitive function late in life but no clearly steeper decline in its main analysis. Brain imaging from Cincinnati and Dunedin found structural differences in adulthood consistent with lasting injury.
Evidence for faster decline is suggestive. A Wisconsin study of people born around 1939 and 1940 found differences in some cognitive trajectories tied to childhood proximity to lead mining, and a 2026 national study of Americans born 1980 to 1984, The Longer Reach of Lead, suggested that lead’s effects may grow over the life course.
Evidence for disease is newest. A 2026 analysis of national survey data found that people in the highest quarter of estimated bone lead had higher rates of Alzheimer’s disease and dementia, though blood lead did not show the same pattern. Telling the three apart needs repeated, comparable tests of the same people over decades, with a validated measure of cumulative lead and a record of ability before aging began.
Lead and Crime
“Lead caused the crime wave.”
Lead is one suspected contributor, not the whole explanation. A 2022 meta-analysis of 24 studies found an association between lead and crime, with wide variation between them. In Cincinnati, childhood blood lead predicted more adult arrests, but arrests also reflect policing, and no study shows that an exposed person is violent.
The most famous claim about lead is that it drove the American crime wave and its decline. The individual-level evidence comes mostly from Cincinnati. In that cohort, each 5 micrograms per deciliter of blood lead at about age 6 was associated with a 27 percent higher adjusted rate of total arrests in early adulthood. A related analysis linked childhood lead to higher scores on some psychopathy-related traits.

In Chicago, Alix Winter and Robert Sampson used actual childhood blood tests and found that each additional microgram per deciliter was associated with more impulsivity and more anxiety and depression symptoms in adolescence, even at the comparatively low exposures of the 1990s. A 2022 meta-analysis of 542 estimates from 24 studies found an association between environmental lead and crime across many designs, with wide differences between them.
None of that makes lead the whole story. Arrests are not offenses: they reflect where police patrol and whom they stop. Ecological studies compare places and years, not people. Lead is a plausible contributor that the evidence supports investigating, not a single cause of historical crime trends, and nothing in the research says an exposed person is violent.
Old Pipes, Old Paint, and Unequal Exposure
“The lead pipe problem was fixed when the new rule passed.”
A rule does not dig up a pipe. EPA’s 2024 lead pipe rule sets its main compliance date at November 1, 2027, and generally gives water systems ten years to replace lead service lines, with exceptions. The work depends on pipe inventories, crews, funding and homeowners, and Congress cut lead line funding for 2026.
National averages hide the places where lead stayed. Children in old and poorly maintained housing, near busy roads and industrial sites, and in poor and segregated neighborhoods carried far more lead than the national figures show. Those differences come from where the lead was, who owned the housing and the pipes, and who had money for remediation, not from anything innate about the people exposed.

In 2014, Flint, Michigan changed its water supply without adequate corrosion protection, and lead from the city’s pipes reached its taps. Flint showed that a regulatory system with a Lead and Copper Rule on the books could still fail an entire city.
For water, the lasting fix is replacement. In 2024, EPA’s Lead and Copper Rule Improvements required broad replacement of lead service lines and certain galvanized lines, generally within ten years, along with stronger sampling and corrosion control and a lower lead action level. The main compliance date is November 1, 2027. A rule is not a finished job: replacement needs an inventory of where the pipes are, skilled workers, financing, and the cooperation of each household.
Delay Under Both Parties, Pressure From Industry
“Republicans blocked lead regulation.”
The record crosses party lines. Nixon’s EPA began the gasoline phasedown in 1973, Reagan’s EPA cut gasoline lead by about 90 percent in 1985 after his own task force had tried to loosen the rules, and George H. W. Bush signed the 1992 lead hazard law. Carter’s Energy Department argued for delaying gasoline lead cuts.
Which party slowed lead regulation? The record does not support a one-party answer. The most consistent organized opponents, especially before the 1970s, were manufacturers, refiners and trade associations. Under Republican Calvin Coolidge, leaded gasoline was investigated in 1925 and returned to the market in 1926. Under Democrats Franklin Roosevelt and Harry Truman and Republican Dwight Eisenhower, lead paint and gasoline stayed in wide use with no national limits despite medical warnings, though inaction alone does not reveal a motive.

Republican Richard Nixon’s administration created the EPA and announced the first gasoline phasedown in 1973. Under Democrat Jimmy Carter, the 1978 paint and air rules took effect, but the Energy Department argued for delaying gasoline lead cuts amid energy concerns while EPA, under Douglas Costle, resisted.
Ronald Reagan’s administration did both. In 1981 and 1982, the Presidential Task Force on Regulatory Relief, chaired by Vice President George H. W. Bush, targeted the gasoline lead standards, the Office of Management and Budget ordered EPA to weaken the rule, and petroleum refiners pressed for repeal. Then EPA reversed course. In 1985, its own analysis found that a 90 percent cut would return benefits far larger than its costs. As president, Bush signed Title X in 1992, and Democrat Bill Clinton’s EPA ended on-road leaded gasoline in 1996.
Later decisions split the same way. George W. Bush’s FY2005 budget request proposed cutting HUD’s lead hazard program by $35 million, a proposal, not an enacted cut. Under Barack Obama and a divided Congress, appropriations for the CDC’s childhood lead program fell from about $29.2 million in FY2011 to $2 million in FY2012. Donald Trump’s first EPA issued a 2020 water rule criticized for allowing slower replacement, Joe Biden’s EPA required replacement within ten years, and in 2026 Trump’s second EPA defended that rule in court while FY2026 appropriations cut lead line funding by about $125 million.
Corporate cost protection runs through the record. The lead-paint industry, refiners, and early Reagan regulatory reviewers argued from compliance costs, fuel supply, prices and jobs. Those motives are documented for specific campaigns. They are not proof of bribery, and they are not a license to assign the same motive to every official of either party.
What a Blood Test Can and Cannot Show
“My blood lead test was low, so I was never exposed.”
A blood test mostly shows recent exposure, because lead leaves the blood within weeks. Lead absorbed in childhood is stored in bone for years or decades, according to the World Health Organization. A low result in adulthood does not rule out heavy exposure long ago, especially for anyone who grew up before leaded gasoline ended.
A blood lead test measures recent exposure and lead that is circulating now. Lead in blood has a half-life on the order of weeks. Lead absorbed years ago is mostly stored in bone, where it can stay for years or decades and return to the blood when bone remodels, including during pregnancy.
So a low blood test at 60 says little about what that person absorbed as a child in 1968. Studies of older adults rely on estimated bone lead or historical reconstruction instead, and in the 2026 dementia analysis it was estimated bone lead, not blood lead, that tracked risk. Baby teeth form in layers that record exposure by stage, which let the Saint Louis studies reach back before birth: one found later depressive symptoms tied to late-pregnancy exposure, another lower adult cognition among women tied to exposure in the second trimester.
The same logic applies to children. A blood test is a snapshot, and one normal result does not clear a home with deteriorating paint or a lead service line. A child’s blood lead also cannot capture everything that came before it.
What Chelation Cannot Undo
“Chelation can get the lead out and undo the damage.”
Chelation lowers blood lead and is used for severe poisoning under medical care. But in a randomized trial of 780 children, reported in the New England Journal of Medicine in 2001, the chelating drug succimer lowered blood lead without improving cognitive, neuropsychological or behavioral outcomes. It is not a reversal of old injury.
Chelation drugs bind lead so the body can excrete it, and for severe poisoning they can be lifesaving under medical care. The harder question is whether they repair harm already done. The Treatment of Lead-Exposed Children trial tested it directly. It randomly assigned 780 children with blood lead of 20 to 44 micrograms per deciliter to the chelating drug succimer or a placebo. Succimer lowered blood lead. It did not improve cognitive, neuropsychological or behavioral outcomes.
That result moves the effort upstream. Removing the source and doing abatement safely prevent further exposure, and treating nutritional deficiencies along with educational and developmental support can improve how children function. Some effects persist after exposure ends, which is why public health guidance centers on keeping lead away from children in the first place.
Reading Population Studies Without Diagnosing Anyone
“Lead gave Gen X personality disorders.”
No study has shown that. Research links childhood lead to somewhat higher average neuroticism and lower conscientiousness and agreeableness, which are trait scores, not diagnoses. A 2024 model estimated millions of excess mental disorders only by assuming earlier associations were causal. None of it can diagnose a person or a generation.
Lead research produces four different kinds of numbers. Measured results come from tests of an individual’s blood, teeth or bone. Modeled results, like the national cohort estimates, are reconstructed from gasoline records and surveys. Associations show that two things travel together after adjustment, not that one caused the other. And some studies assume causation in order to estimate a total burden. Mixing them up produces most of the bad claims about lead.
Personality research shows what is at stake. The Dunedin cohort found that higher childhood lead was associated with higher neuroticism and lower agreeableness and conscientiousness in adulthood, and a study of more than 1.5 million responses in the United States and Europe, using estimated atmospheric lead where people grew up, found related patterns. These are trait scores, not diagnoses. No study presented establishes that lead causes narcissistic, borderline or antisocial personality disorder in a person or a generation.
The largest numbers are the most conditional. A model published in 2024 by the authors of the cohort study estimated 151 million excess mental disorders in the U.S. population over 75 years and a 0.13 standard deviation increase in overall liability to psychopathology, with the largest burden among people born roughly 1966 to 1986. It reached those figures by assuming earlier associations were causal. They are modeled totals, not 151 million diagnosed people.
Population findings describe averages across many people. They cannot diagnose anyone’s intelligence, mental health, personality, criminality or politics from a birth year, a neighborhood or a guess about childhood exposure. The supported claim is narrower: the most exposed cohorts may have carried higher average cognitive and some psychiatric risks into adulthood.